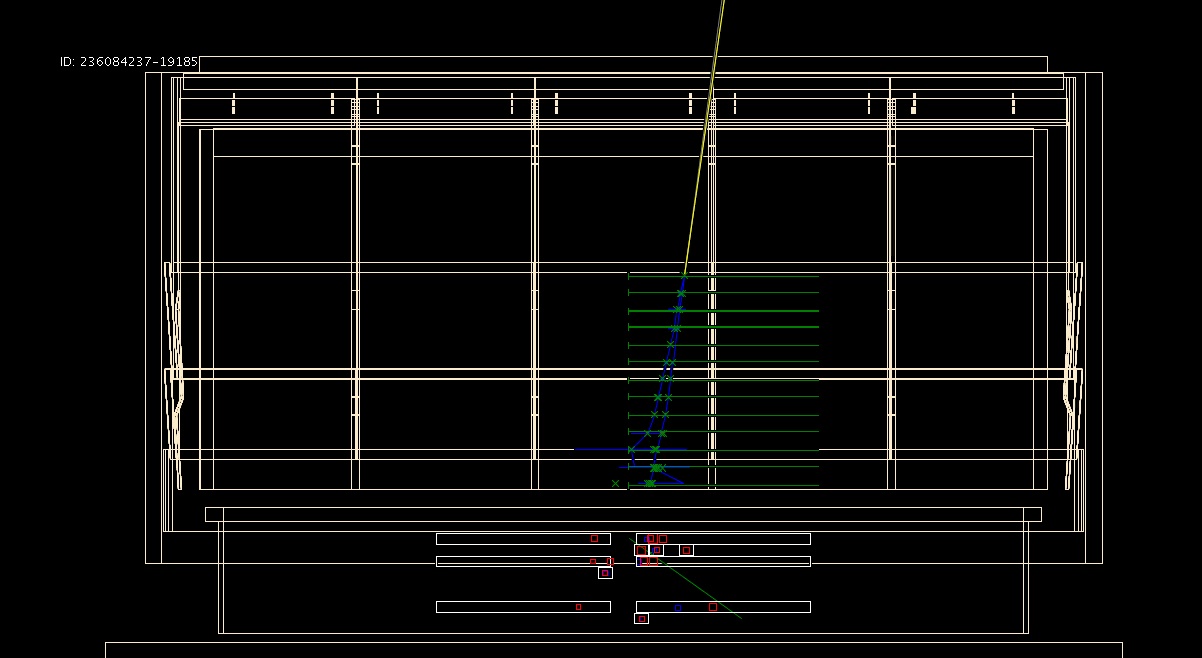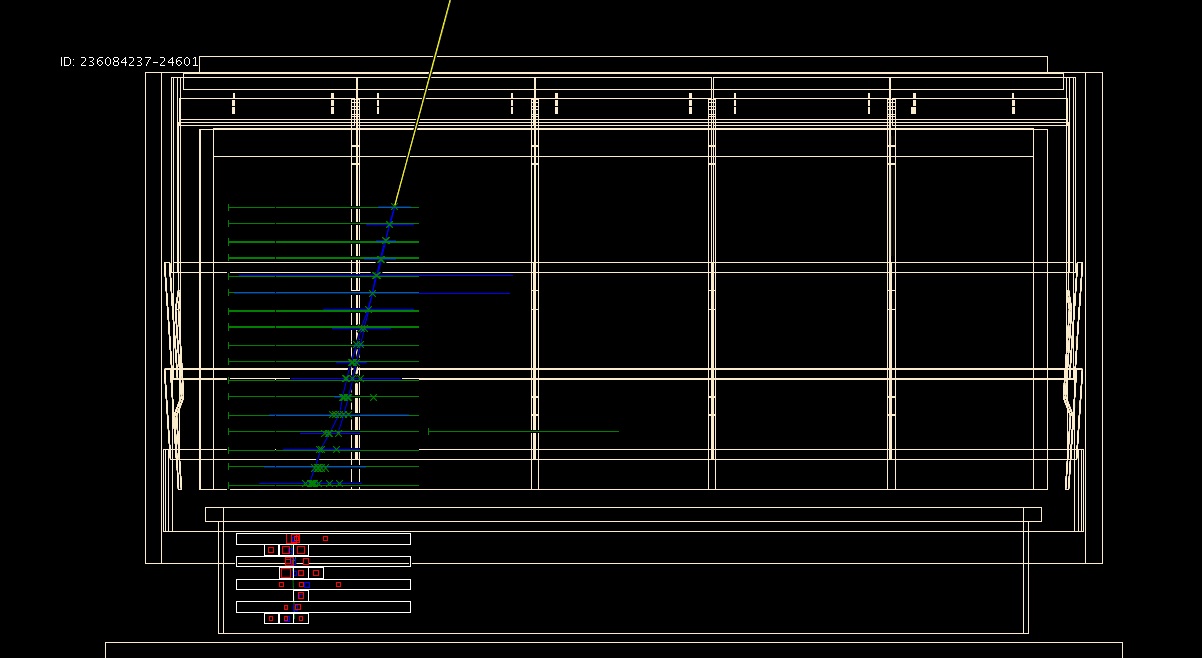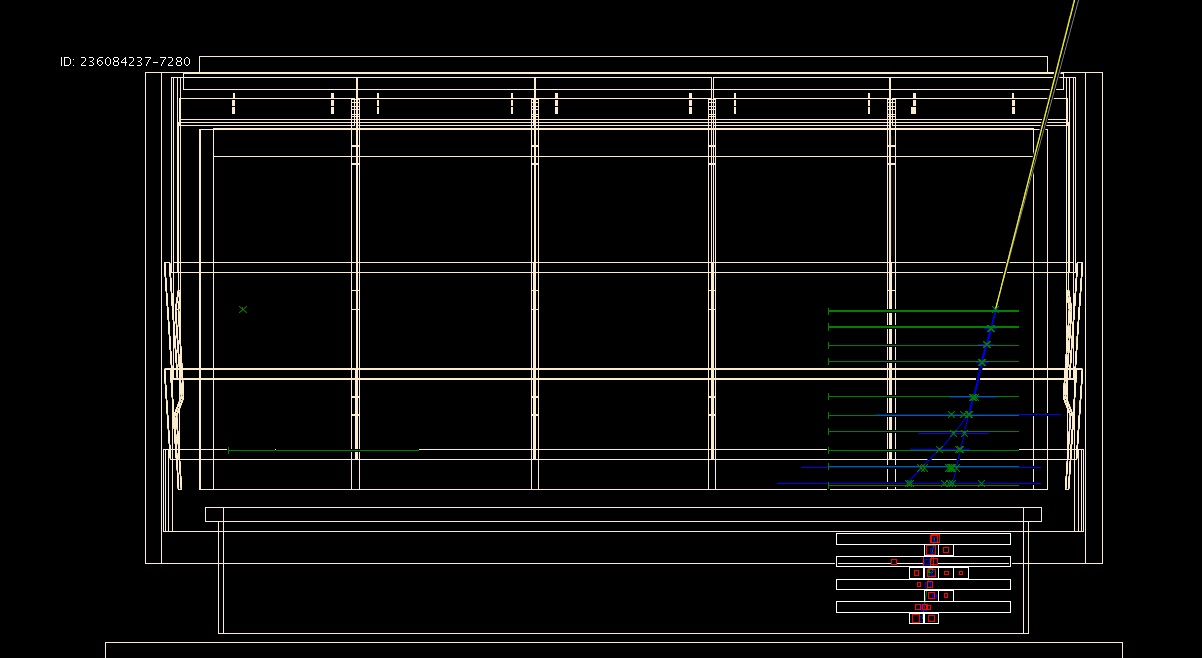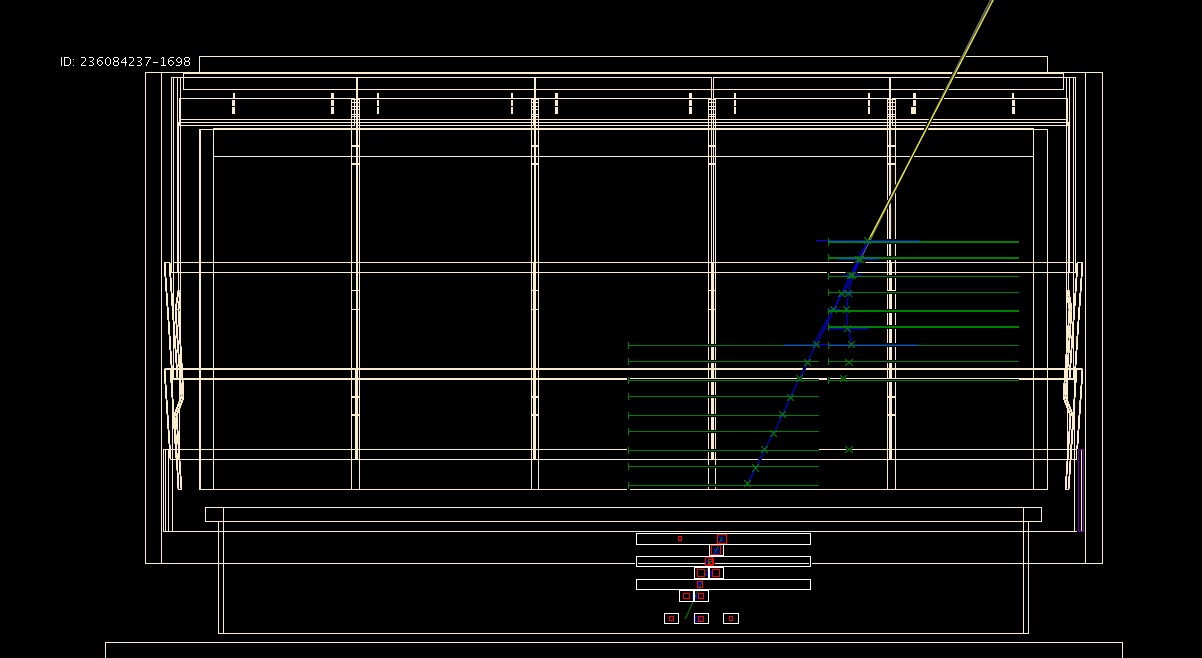
Event Displays
Single event displays, showing the detector information in graphical form, from four
of the many events that passed the nominal gamma-ray selection criteria in the early
mission engineering data. Note that the instrument is still undergoing tuning and
detailed checkout in preparation for science observations, but these events illustrate
that the instrument is basically working very well. In particular, the sensors show
very high detection efficiency with very low noise. The event reconstruction
software is also working well.
Click on a thumbnail picture for a full-sized image.
The green crosses show the detected positions of the charged particles, the blue lines
show the reconstructed track trajectories, and the yellow line shows the candidate
gamma-ray estimated direction. The red crosses show the detected energy depositions
in the calorimeter. The anticoincidence detector shows no incoming charged particles
in these events.